Analytics
The Analytics module creates real-time graphs and tables displaying data related to your sales and services. You can specify the time period for your reports.
Initial Configuration
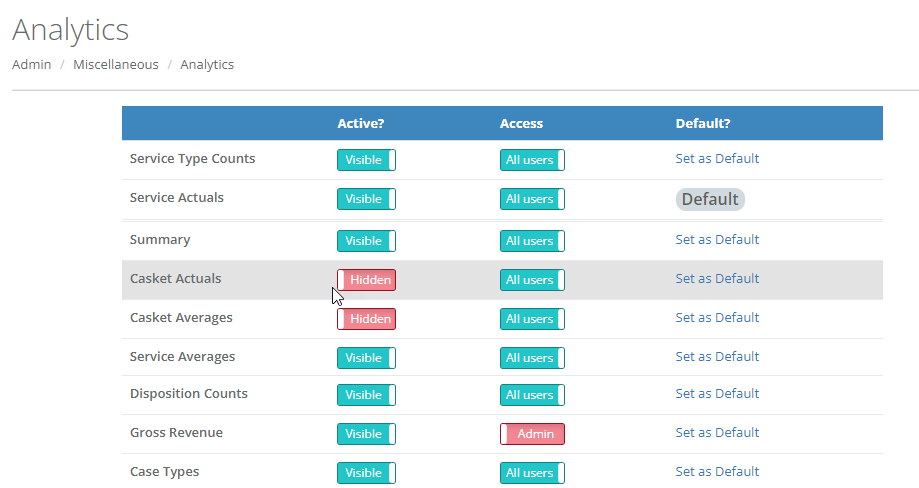
Users with Administrator level access can set up which reports are available, whether the reports are available to all users or only administrators, and the default report. This is done under Administration > Miscellaneous > Analytics.
Analytics Reports
Use the drop-down menu to select the graph you want to see and add a date range for the report under Date Range 1. If you would like to compare two time periods, for example May vs June, or Quarter 1 vs Quarter 2, include a second time period in Date Range 2. Note: Summary reports use Date Range 1. Click the blue Update Graph button to update see the report.
Hover your mouse over the chart to see the counts and the percentages.
A table appears below the charts and each column can be sorted by clicking the sort button in the headings.
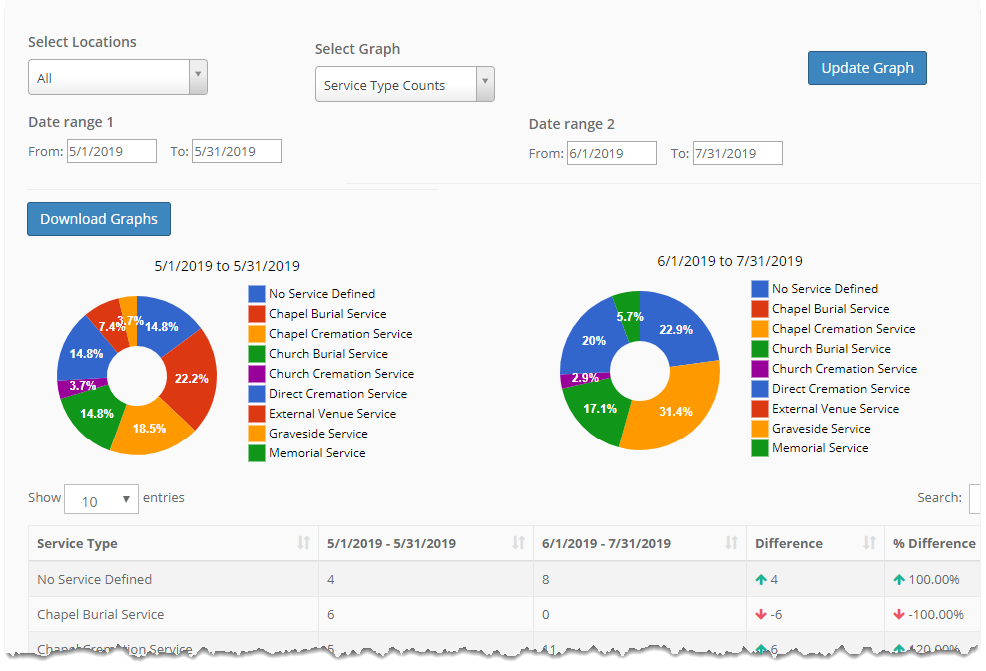
Click the Download Graphs button to export your report into a pdf document.
If you are a multi use site with superadmin rights you have the choice of selecting a particular location or running all locations combined.
Comments
0 comments
Please sign in to leave a comment.